付録:Telegraf を用いたIPCのWindowsメトリクス計測#
Windowsのパフォーマンスを計測するには、Performance monitorがありますが、基本的にWindowsのGUIアプリケーションや.NETのAPIなどを通じてデータ活用する必要があります。
InfluxDBには姉妹品としてTelegrafと呼ばれるエージェントがあり、Performance monitorで計測できるさまざまなカウンタ値をInfluxDBへ記録できます。
この節では、Windowsの診断情報をInfluxDBへ記録する方法について説明します。
IPCへのTelegrafのインストール#
注釈
telegrafは、Beckhoff IPC上にインストールします。telegrafはWindows上のさまざまな稼働データを収集して、influxDBへ記録する機能を果たします。
influxDBは別の専用サーバに設置していただく場合でも、telegrafはネットワーク経由でさまざまなメトリクスを記録することができます。よって、工場内の全てのIPCに本手順書によるtelegarfをインストールしておき、一か所のinfluxDBサーバへ記録させることで、全IPCの健康状態を監視することが可能になります。
InfluxData社からは、Telegrafと呼ばれるデータ収集エージェントが別途リリースされています。これを用いることで、IPCのWindowsやIPCのハードウェアに関する各種メトリクスを収集し、InfluxDBへ時系列記録させることができます。
https://portal.influxdata.com/downloads/にアクセスし、TelegrafのWindows binaries(64bit)を選択します。ここに現われたコマンド行2行をクリップボードコピーします。
wget https://dl.influxdata.com/telegraf/releases/telegraf-1.27.0_windows_amd64.zip -UseBasicParsing -OutFile telegraf-1.27.0_windows_amd64.zip
Expand-Archive .\telegraf-1.27.0_windows_amd64.zip -DestinationPath 'C:\Program Files\InfluxData\telegraf'
警告
本節の手順ではtelegrafのバージョン1.27.0を例として説明します。以後、上記のinfluxdataのダウンロードサイトから得られる最新のバージョンに読み替えてください。
管理者権限でPowershellを開き、コピーしたコマンドを2行実行します。これによりインターネットからtelegrafをダウンロードし、
C:\Program Files\InfluxData\telegraf以下に展開します。influxDBのアクセストークンを発行します。この例では、adminユーザとしての権限でinfluxDBへアクセスするトークンを発行しますが、適切な権限に制限した一般ユーザのトークンを発行した方がセキュリティ上においても適切です。
Bucket設定メニューから
API Tokensを選択します。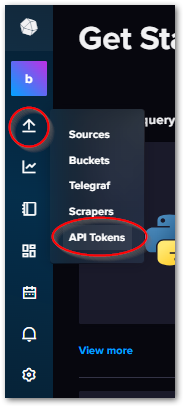
外部からアクセスしたい権限と同じ権限を持ったユーザの右側にある歯車アイコンをクリックし、
Cloneボタンを押します。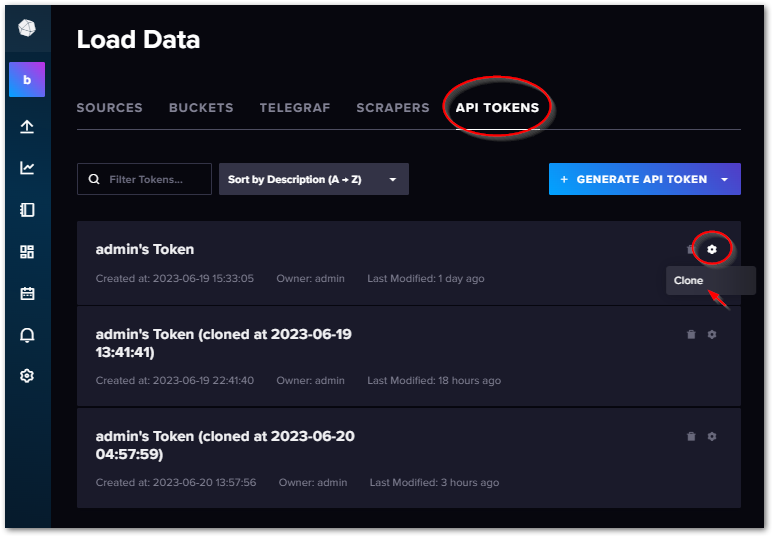
API Tokenが表示されたウィンドウがポップアップされます。この文字列をクリップボードにコピーしてください。

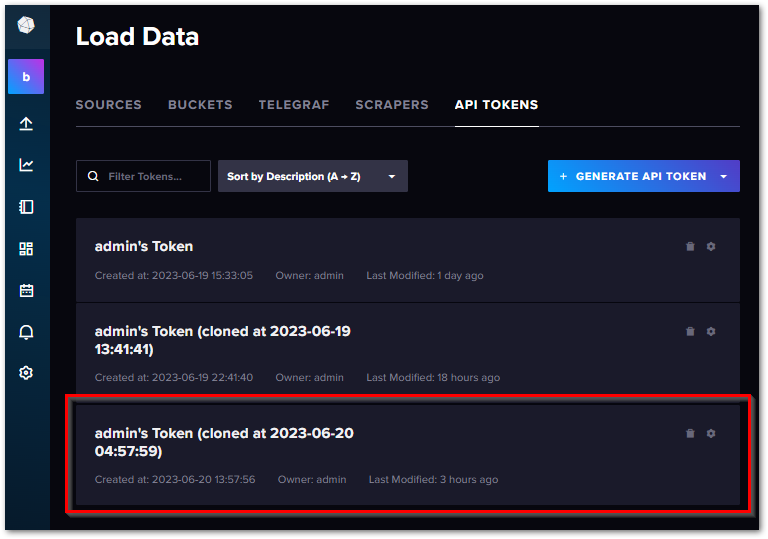
登録が完了したら、最新のTokenが最下部に一覧されます。
警告
コピーする前にポップアップウィンドウ閉じたり、次の手順でAPI Tokenを定義ファイルに書き写す前にクリップボードから削除してしまった場合、API Tokenは二度と閲覧することはできません。一度ごみばこアイコンでTokenを削除して、再度同様の手順で作り直してください。
展開されたフォルダ内に生成された
telegraf.confファイルをテキストエディタで以下の要領で編集します。OUTPUT PLUGINS
telegrafからデータを出力する先に関する設定です。
セクション
キー
値
[[outputs.influxdb_v2]]urls
InfluxDBへアクセスするURL
token
前項で取得したAPI Tokenを設定します
organization
接続するinfluxDBのorganizaionを設定します。
bucket
接続するinfluxDBのbucketを設定します。
INPUT PLUGINS
telegrafで収集するデータ元に関する設定です。
セクション
キー
値
[[inputs.cpu]][[inputs.disk]][[inputs.diskio]][[inputs.kernel]][[inputs.mem]][[inputs.processes]][[inputs.swap]][[inputs.system]]全て
後述するwin_perf_countersで収集するため、こちらはコメントアウトして無効化する。
[[inputs.win_perf_counters]][[inputs.win_perf_counters.object]].Processer, LogicalDisk, PhysicalDisk, Network Interface, System, Memory, Paging fileデフォルト設定のままコメントを外して有効化。Windowsの基本的なパフォーマンスデータを収集。
追加
[[inputs.win_perf_counters.object]].ProcessInstancesで指定したプロセスのCPU使用率、メモリ使用量などのメトリクスを収集します。[[inputs.win_wmi]]コメントアウトを外して有効化。WMIで収集できるメトリクスを収集可能。ディスク使用量、残量などを収集。
以上を編集した後の例を以下のとおりunified diff形式で示します。
  1--- C:/Users/Takashii/Documents/manual/TwinCATHowTo/source/influxdb/assets/telegraf.conf.org    Tue Jun 20 17:44:29 2023
  2+++ C:/Users/Takashii/Documents/manual/TwinCATHowTo/source/influxdb/assets/telegraf.conf    Tue Jun 20 17:45:52 2023
  3@@ -275,22 +275,22 @@
  4
  5
  6 # # Configuration for sending metrics to InfluxDB 2.0
  7-# [[outputs.influxdb_v2]]
  8+[[outputs.influxdb_v2]]
  9 #   ## The URLs of the InfluxDB cluster nodes.
 10 #   ##
 11 #   ## Multiple URLs can be specified for a single cluster, only ONE of the
 12 #   ## urls will be written to each interval.
 13 #   ##   ex: urls = ["https://us-west-2-1.aws.cloud2.influxdata.com"]
 14-#   urls = ["http://127.0.0.1:8086"]
 15+  urls = ["http://192.168.1.32:8086"]
 16 #
 17 #   ## Token for authentication.
 18-#   token = ""
 19+  token = "m4PbYq_vVRZDjbgRwyEF4BXPDpinq7CkBRX4JJnYNacbD6bSSLaF3AsDvip9vQfmF0A8ZpOlQHYBawCHf_X6-g=="
 20 #
 21 #   ## Organization is the name of the organization you wish to write to.
 22-#   organization = ""
 23+  organization = "beckhoff.co.jp"
 24 #
 25 #   ## Destination bucket to write into.
 26-#   bucket = ""
 27+  bucket = "machine_data"
 28 #
 29 #   ## The value of this tag will be used to determine the bucket.  If this
 30 #   ## tag is not set the 'bucket' option is used as the default.
 31@@ -3786,95 +3786,95 @@
 32 ###############################################################################
 33
 34
 35-# Read metrics about cpu usage
 36-[[inputs.cpu]]
 37-  ## Whether to report per-cpu stats or not
 38-  percpu = true
 39-  ## Whether to report total system cpu stats or not
 40-  totalcpu = true
 41-  ## If true, collect raw CPU time metrics
 42-  collect_cpu_time = false
 43-  ## If true, compute and report the sum of all non-idle CPU states
 44-  report_active = false
 45-  ## If true and the info is available then add core_id and physical_id tags
 46-  core_tags = false
 47-
 48-
 49-# Read metrics about disk usage by mount point
 50-[[inputs.disk]]
 51-  ## By default stats will be gathered for all mount points.
 52-  ## Set mount_points will restrict the stats to only the specified mount points.
 53-  # mount_points = ["/"]
 54-
 55-  ## Ignore mount points by filesystem type.
 56-  ignore_fs = ["tmpfs", "devtmpfs", "devfs", "iso9660", "overlay", "aufs", "squashfs"]
 57-
 58-  ## Ignore mount points by mount options.
 59-  ## The 'mount' command reports options of all mounts in parathesis.
 60-  ## Bind mounts can be ignored with the special 'bind' option.
 61-  # ignore_mount_opts = []
 62-
 63-
 64-# Read metrics about disk IO by device
 65-[[inputs.diskio]]
 66-  ## By default, telegraf will gather stats for all devices including
 67-  ## disk partitions.
 68-  ## Setting devices will restrict the stats to the specified devices.
 69-  ## NOTE: Globbing expressions (e.g. asterix) are not supported for
 70-  ##       disk synonyms like '/dev/disk/by-id'.
 71-  # devices = ["sda", "sdb", "vd*", "/dev/disk/by-id/nvme-eui.00123deadc0de123"]
 72-  ## Uncomment the following line if you need disk serial numbers.
 73-  # skip_serial_number = false
 74-  #
 75-  ## On systems which support it, device metadata can be added in the form of
 76-  ## tags.
 77-  ## Currently only Linux is supported via udev properties. You can view
 78-  ## available properties for a device by running:
 79-  ## 'udevadm info -q property -n /dev/sda'
 80-  ## Note: Most, but not all, udev properties can be accessed this way. Properties
 81-  ## that are currently inaccessible include DEVTYPE, DEVNAME, and DEVPATH.
 82-  # device_tags = ["ID_FS_TYPE", "ID_FS_USAGE"]
 83-  #
 84-  ## Using the same metadata source as device_tags, you can also customize the
 85-  ## name of the device via templates.
 86-  ## The 'name_templates' parameter is a list of templates to try and apply to
 87-  ## the device. The template may contain variables in the form of '$PROPERTY' or
 88-  ## '${PROPERTY}'. The first template which does not contain any variables not
 89-  ## present for the device is used as the device name tag.
 90-  ## The typical use case is for LVM volumes, to get the VG/LV name instead of
 91-  ## the near-meaningless DM-0 name.
 92-  # name_templates = ["$ID_FS_LABEL","$DM_VG_NAME/$DM_LV_NAME"]
 93-
 94-
 95-# Get kernel statistics from /proc/stat
 96-# This plugin ONLY supports Linux
 97-[[inputs.kernel]]
 98-  # no configuration
 99-
100-
101-# Read metrics about memory usage
102-[[inputs.mem]]
103-  # no configuration
104-
105-
106-# Get the number of processes and group them by status
107-# This plugin ONLY supports non-Windows
108-[[inputs.processes]]
109-  ## Use sudo to run ps command on *BSD systems. Linux systems will read
110-  ## /proc, so this does not apply there.
111-  use_sudo = false
112-
113-
114-# Read metrics about swap memory usage
115-[[inputs.swap]]
116-  # no configuration
117-
118-
119-# Read metrics about system load & uptime
120-[[inputs.system]]
121-  # no configuration
122-
123-
124+# # Read metrics about cpu usage
125+# [[inputs.cpu]]
126+#   ## Whether to report per-cpu stats or not
127+#   percpu = true
128+#   ## Whether to report total system cpu stats or not
129+#   totalcpu = true
130+#   ## If true, collect raw CPU time metrics
131+#   collect_cpu_time = false
132+#   ## If true, compute and report the sum of all non-idle CPU states
133+#   report_active = false
134+#   ## If true and the info is available then add core_id and physical_id tags
135+#   core_tags = false
136+#
137+#
138+# # Read metrics about disk usage by mount point
139+# [[inputs.disk]]
140+#   ## By default stats will be gathered for all mount points.
141+#   ## Set mount_points will restrict the stats to only the specified mount points.
142+#   # mount_points = ["/"]
143+#
144+#   ## Ignore mount points by filesystem type.
145+#   ignore_fs = ["tmpfs", "devtmpfs", "devfs", "iso9660", "overlay", "aufs", "squashfs"]
146+#
147+#   ## Ignore mount points by mount options.
148+#   ## The 'mount' command reports options of all mounts in parathesis.
149+#   ## Bind mounts can be ignored with the special 'bind' option.
150+#   # ignore_mount_opts = []
151+#
152+#
153+# # Read metrics about disk IO by device
154+# [[inputs.diskio]]
155+#   ## By default, telegraf will gather stats for all devices including
156+#   ## disk partitions.
157+#   ## Setting devices will restrict the stats to the specified devices.
158+#   ## NOTE: Globbing expressions (e.g. asterix) are not supported for
159+#   ##       disk synonyms like '/dev/disk/by-id'.
160+#   # devices = ["sda", "sdb", "vd*", "/dev/disk/by-id/nvme-eui.00123deadc0de123"]
161+#   ## Uncomment the following line if you need disk serial numbers.
162+#   # skip_serial_number = false
163+#   #
164+#   ## On systems which support it, device metadata can be added in the form of
165+#   ## tags.
166+#   ## Currently only Linux is supported via udev properties. You can view
167+#   ## available properties for a device by running:
168+#   ## 'udevadm info -q property -n /dev/sda'
169+#   ## Note: Most, but not all, udev properties can be accessed this way. Properties
170+#   ## that are currently inaccessible include DEVTYPE, DEVNAME, and DEVPATH.
171+#   # device_tags = ["ID_FS_TYPE", "ID_FS_USAGE"]
172+#   #
173+#   ## Using the same metadata source as device_tags, you can also customize the
174+#   ## name of the device via templates.
175+#   ## The 'name_templates' parameter is a list of templates to try and apply to
176+#   ## the device. The template may contain variables in the form of '$PROPERTY' or
177+#   ## '${PROPERTY}'. The first template which does not contain any variables not
178+#   ## present for the device is used as the device name tag.
179+#   ## The typical use case is for LVM volumes, to get the VG/LV name instead of
180+#   ## the near-meaningless DM-0 name.
181+#   # name_templates = ["$ID_FS_LABEL","$DM_VG_NAME/$DM_LV_NAME"]
182+#
183+#
184+# # Get kernel statistics from /proc/stat
185+# # This plugin ONLY supports Linux
186+# [[inputs.kernel]]
187+#   # no configuration
188+#
189+#
190+# # Read metrics about memory usage
191+# [[inputs.mem]]
192+#   # no configuration
193+#
194+#
195+# # Get the number of processes and group them by status
196+# # This plugin ONLY supports non-Windows
197+# [[inputs.processes]]
198+#   ## Use sudo to run ps command on *BSD systems. Linux systems will read
199+#   ## /proc, so this does not apply there.
200+#   #use_sudo = false
201+#
202+#
203+# # Read metrics about swap memory usage
204+# [[inputs.swap]]
205+#   # no configuration
206+#
207+#
208+# # Read metrics about system load & uptime
209+# [[inputs.system]]
210+#   # no configuration
211+#
212+#
213 # # Gather ActiveMQ metrics
214 # [[inputs.activemq]]
215 #   ## ActiveMQ WebConsole URL
216@@ -8511,141 +8511,149 @@
217
218 # # # Input plugin to counterPath Performance Counters on Windows operating systems
219 # # # This plugin ONLY supports Windows
220-# # [[inputs.win_perf_counters]]
221-# #   ## By default this plugin returns basic CPU and Disk statistics.
222-# #   ## See the README file for more examples.
223-# #   ## Uncomment examples below or write your own as you see fit. If the system
224-# #   ## being polled for data does not have the Object at startup of the Telegraf
225-# #   ## agent, it will not be gathered.
226-# #   ## Settings:
227-# #   # PrintValid = false # Print All matching performance counters
228-# #   # Whether request a timestamp along with the PerfCounter data or just use current time
229-# #   # UsePerfCounterTime=true
230-# #   # If UseWildcardsExpansion params is set to true, wildcards (partial wildcards in instance names and wildcards in counters names) in configured counter paths will be expanded
231-# #   # and in case of localized Windows, counter paths will be also localized. It also returns instance indexes in instance names.
232-# #   # If false, wildcards (not partial) in instance names will still be expanded, but instance indexes will not be returned in instance names.
233-# #   #UseWildcardsExpansion = false
234-# #   # When running on a localized version of Windows and with UseWildcardsExpansion = true, Windows will
235-# #   # localize object and counter names. When LocalizeWildcardsExpansion = false, use the names in object.Counters instead
236-# #   # of the localized names. Only Instances can have wildcards in this case. ObjectName and Counters must not have wildcards when this
237-# #   # setting is false.
238-# #   #LocalizeWildcardsExpansion = true
239-# #   # Period after which counters will be reread from configuration and wildcards in counter paths expanded
240-# #   CountersRefreshInterval="1m"
241-# #   ## Accepts a list of PDH error codes which are defined in pdh.go, if this error is encountered it will be ignored
242-# #   ## For example, you can provide "PDH_NO_DATA" to ignore performance counters with no instances
243-# #   ## By default no errors are ignored
244-# #   ## You can find the list here: https://github.com/influxdata/telegraf/blob/master/plugins/inputs/win_perf_counters/pdh.go
245-# #   ## e.g.: IgnoredErrors = ["PDH_NO_DATA"]
246-# #   # IgnoredErrors = []
247-# #
248-# #   [[inputs.win_perf_counters.object]]
249-# #     # Processor usage, alternative to native, reports on a per core.
250-# #     ObjectName = "Processor"
251-# #     Instances = ["*"]
252-# #     Counters = [
253-# #       "% Idle Time",
254-# #       "% Interrupt Time",
255-# #       "% Privileged Time",
256-# #       "% User Time",
257-# #       "% Processor Time",
258-# #       "% DPC Time",
259-# #     ]
260-# #     Measurement = "win_cpu"
261-# #     # Set to true to include _Total instance when querying for all (*).
262-# #     # IncludeTotal=false
263-# #     # Print out when the performance counter is missing from object, counter or instance.
264-# #     # WarnOnMissing = false
265-# #     # Gather raw values instead of formatted. Raw value is stored in the field name with the "_Raw" suffix, e.g. "Disk_Read_Bytes_sec_Raw".
266-# #     # UseRawValues = true
267-# #
268-# #   [[inputs.win_perf_counters.object]]
269-# #     # Disk times and queues
270-# #     ObjectName = "LogicalDisk"
271-# #     Instances = ["*"]
272-# #     Counters = [
273-# #       "% Idle Time",
274-# #       "% Disk Time",
275-# #       "% Disk Read Time",
276-# #       "% Disk Write Time",
277-# #       "% User Time",
278-# #       "% Free Space",
279-# #       "Current Disk Queue Length",
280-# #       "Free Megabytes",
281-# #     ]
282-# #     Measurement = "win_disk"
283-# #
284-# #   [[inputs.win_perf_counters.object]]
285-# #     ObjectName = "PhysicalDisk"
286-# #     Instances = ["*"]
287-# #     Counters = [
288-# #       "Disk Read Bytes/sec",
289-# #       "Disk Write Bytes/sec",
290-# #       "Current Disk Queue Length",
291-# #       "Disk Reads/sec",
292-# #       "Disk Writes/sec",
293-# #       "% Disk Time",
294-# #       "% Disk Read Time",
295-# #       "% Disk Write Time",
296-# #     ]
297-# #     Measurement = "win_diskio"
298-# #
299-# #   [[inputs.win_perf_counters.object]]
300-# #     ObjectName = "Network Interface"
301-# #     Instances = ["*"]
302-# #     Counters = [
303-# #       "Bytes Received/sec",
304-# #       "Bytes Sent/sec",
305-# #       "Packets Received/sec",
306-# #       "Packets Sent/sec",
307-# #       "Packets Received Discarded",
308-# #       "Packets Outbound Discarded",
309-# #       "Packets Received Errors",
310-# #       "Packets Outbound Errors",
311-# #     ]
312-# #     Measurement = "win_net"
313-# #
314-# #
315-# #   [[inputs.win_perf_counters.object]]
316-# #     ObjectName = "System"
317-# #     Counters = [
318-# #       "Context Switches/sec",
319-# #       "System Calls/sec",
320-# #       "Processor Queue Length",
321-# #       "System Up Time",
322-# #     ]
323-# #     Instances = ["------"]
324-# #     Measurement = "win_system"
325-# #
326-# #   [[inputs.win_perf_counters.object]]
327-# #     # Example counterPath where the Instance portion must be removed to get data back,
328-# #     # such as from the Memory object.
329-# #     ObjectName = "Memory"
330-# #     Counters = [
331-# #       "Available Bytes",
332-# #       "Cache Faults/sec",
333-# #       "Demand Zero Faults/sec",
334-# #       "Page Faults/sec",
335-# #       "Pages/sec",
336-# #       "Transition Faults/sec",
337-# #       "Pool Nonpaged Bytes",
338-# #       "Pool Paged Bytes",
339-# #       "Standby Cache Reserve Bytes",
340-# #       "Standby Cache Normal Priority Bytes",
341-# #       "Standby Cache Core Bytes",
342-# #     ]
343-# #     Instances = ["------"] # Use 6 x - to remove the Instance bit from the counterPath.
344-# #     Measurement = "win_mem"
345-# #
346-# #   [[inputs.win_perf_counters.object]]
347-# #     # Example query where the Instance portion must be removed to get data back,
348-# #     # such as from the Paging File object.
349-# #     ObjectName = "Paging File"
350-# #     Counters = [
351-# #       "% Usage",
352-# #     ]
353-# #     Instances = ["_Total"]
354-# #     Measurement = "win_swap"
355+[[inputs.win_perf_counters]]
356+   ## By default this plugin returns basic CPU and Disk statistics.
357+   ## See the README file for more examples.
358+   ## Uncomment examples below or write your own as you see fit. If the system
359+   ## being polled for data does not have the Object at startup of the Telegraf
360+   ## agent, it will not be gathered.
361+   ## Settings:
362+   # PrintValid = false # Print All matching performance counters
363+   # Whether request a timestamp along with the PerfCounter data or just use current time
364+   # UsePerfCounterTime=true
365+   # If UseWildcardsExpansion params is set to true, wildcards (partial wildcards in instance names and wildcards in counters names) in configured counter paths will be expanded
366+   # and in case of localized Windows, counter paths will be also localized. It also returns instance indexes in instance names.
367+   # If false, wildcards (not partial) in instance names will still be expanded, but instance indexes will not be returned in instance names.
368+   #UseWildcardsExpansion = false
369+   # When running on a localized version of Windows and with UseWildcardsExpansion = true, Windows will
370+   # localize object and counter names. When LocalizeWildcardsExpansion = false, use the names in object.Counters instead
371+   # of the localized names. Only Instances can have wildcards in this case. ObjectName and Counters must not have wildcards when this
372+   # setting is false.
373+   #LocalizeWildcardsExpansion = true
374+   # Period after which counters will be reread from configuration and wildcards in counter paths expanded
375+   CountersRefreshInterval="1m"
376+   ## Accepts a list of PDH error codes which are defined in pdh.go, if this error is encountered it will be ignored
377+   ## For example, you can provide "PDH_NO_DATA" to ignore performance counters with no instances
378+   ## By default no errors are ignored
379+   ## You can find the list here: https://github.com/influxdata/telegraf/blob/master/plugins/inputs/win_perf_counters/pdh.go
380+   ## e.g.: IgnoredErrors = ["PDH_NO_DATA"]
381+   # IgnoredErrors = []
382+
383+   [[inputs.win_perf_counters.object]]
384+     # Processor usage, alternative to native, reports on a per core.
385+     ObjectName = "Processor"
386+     Instances = ["*"]
387+     Counters = [
388+       "% Idle Time",
389+       "% Interrupt Time",
390+       "% Privileged Time",
391+       "% User Time",
392+       "% Processor Time",
393+       "% DPC Time",
394+     ]
395+     Measurement = "win_cpu"
396+     # Set to true to include _Total instance when querying for all (*).
397+     # IncludeTotal=false
398+     # Print out when the performance counter is missing from object, counter or instance.
399+     # WarnOnMissing = false
400+     # Gather raw values instead of formatted. Raw value is stored in the field name with the "_Raw" suffix, e.g. "Disk_Read_Bytes_sec_Raw".
401+     # UseRawValues = true
402+
403+   [[inputs.win_perf_counters.object]]
404+     # Disk times and queues
405+     ObjectName = "LogicalDisk"
406+     Instances = ["*"]
407+     Counters = [
408+       "% Idle Time",
409+       "% Disk Time",
410+       "% Disk Read Time",
411+       "% Disk Write Time",
412+       "% User Time",
413+       "% Free Space",
414+       "Current Disk Queue Length",
415+       "Free Megabytes",
416+     ]
417+     Measurement = "win_disk"
418+
419+   [[inputs.win_perf_counters.object]]
420+     ObjectName = "PhysicalDisk"
421+     Instances = ["*"]
422+     Counters = [
423+       "Disk Read Bytes/sec",
424+       "Disk Write Bytes/sec",
425+       "Current Disk Queue Length",
426+       "Disk Reads/sec",
427+       "Disk Writes/sec",
428+       "% Disk Time",
429+       "% Disk Read Time",
430+       "% Disk Write Time",
431+     ]
432+     Measurement = "win_diskio"
433+
434+   [[inputs.win_perf_counters.object]]
435+     ObjectName = "Network Interface"
436+     Instances = ["*"]
437+     Counters = [
438+       "Bytes Received/sec",
439+       "Bytes Sent/sec",
440+       "Packets Received/sec",
441+       "Packets Sent/sec",
442+       "Packets Received Discarded",
443+       "Packets Outbound Discarded",
444+       "Packets Received Errors",
445+       "Packets Outbound Errors",
446+     ]
447+     Measurement = "win_net"
448+
449+
450+   [[inputs.win_perf_counters.object]]
451+     ObjectName = "System"
452+     Counters = [
453+       "Context Switches/sec",
454+       "System Calls/sec",
455+       "Processor Queue Length",
456+       "System Up Time",
457+     ]
458+     Instances = ["------"]
459+     Measurement = "win_system"
460+
461+   [[inputs.win_perf_counters.object]]
462+     # Example counterPath where the Instance portion must be removed to get data back,
463+     # such as from the Memory object.
464+     ObjectName = "Memory"
465+     Counters = [
466+       "Available Bytes",
467+       "Cache Faults/sec",
468+       "Demand Zero Faults/sec",
469+       "Page Faults/sec",
470+       "Pages/sec",
471+       "Transition Faults/sec",
472+       "Pool Nonpaged Bytes",
473+       "Pool Paged Bytes",
474+       "Standby Cache Reserve Bytes",
475+       "Standby Cache Normal Priority Bytes",
476+       "Standby Cache Core Bytes",
477+     ]
478+     Instances = ["------"] # Use 6 x - to remove the Instance bit from the counterPath.
479+     Measurement = "win_mem"
480+
481+   [[inputs.win_perf_counters.object]]
482+     # Example query where the Instance portion must be removed to get data back,
483+     # such as from the Paging File object.
484+     ObjectName = "Paging File"
485+     Counters = [
486+       "% Usage",
487+     ]
488+     Instances = ["_Total"]
489+     Measurement = "win_swap"
490+
491+    [[inputs.win_perf_counters.object]]
492+      # Process metrics, in this case for IIS only
493+      ObjectName = "Process"
494+      Counters = ["% Processor Time","Handle Count","Private Bytes","Thread Count","Virtual Bytes","Working Set"]
495+      Instances = ["TcSysUI", "TCATSysSrv", "TcNcI", "TcHmiSrv", "TF6420Server"]
496+      Measurement = "win_proc"
497+      #IncludeTotal=false #Set to true to include _Total instance when querying for all (*).
498
499
500 # # Input plugin to report Windows services info.
501@@ -8660,20 +8668,21 @@
502 #   excluded_service_names = ['WinRM'] # optional, list of service names to exclude
503
504
505-# # Input plugin to query Windows Management Instrumentation
506-# # This plugin ONLY supports Windows
507-# [[inputs.win_wmi]]
508-#   [[inputs.win_wmi.query]]
509-#     # a string representing the WMI namespace to be queried
510-#     namespace = "root\\cimv2"
511-#     # a string representing the WMI class to be queried
512-#     class_name = "Win32_Volume"
513-#     # an array of strings representing the properties of the WMI class to be queried
514-#     properties = ["Name", "Capacity", "FreeSpace"]
515-#     # a string specifying a WHERE clause to use as a filter for the WQL
516-#     filter = 'NOT Name LIKE "\\\\?\\%"'
517-#     # WMI class properties which should be considered tags instead of fields
518-#     tag_properties = ["Name"]
519+# Input plugin to query Windows Management Instrumentation
520+# This plugin ONLY supports Windows
521+[[inputs.win_wmi]]
522+  [[inputs.win_wmi.query]]
523+    # a string representing the WMI namespace to be queried
524+    namespace = "root\\cimv2"
525+    # a string representing the WMI class to be queried
526+    class_name = "Win32_Volume"
527+    # an array of strings representing the properties of the WMI class to be queried
528+    properties = ["Name", "Capacity", "FreeSpace"]
529+    # a string specifying a WHERE clause to use as a filter for the WQL
530+    filter = 'NOT Name LIKE "\\\\?\\%"'
531+    # WMI class properties which should be considered tags instead of fields
532+    tag_properties = ["Name"]
533+
534
535
536 # # Collect Wireguard server interface and peer statistics
再度管理者権限で実行されたPowershell内で、以下のコマンドを実行します。
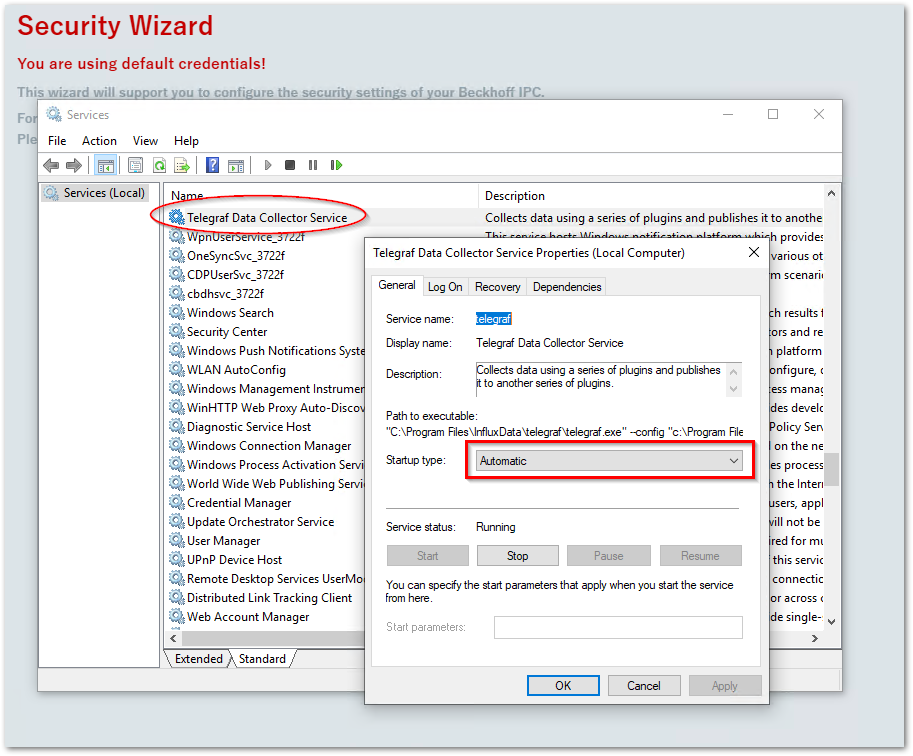
PS> C:\Program Files\InfluxData\telegraf\telegraf-1.27.0\telegraf.exe --service install --config "C:\Program Files\InfluxData\telegraf\telegraf-1.27.0\telegraf.conf"
PS> net telegraf start
以上の設定により、IPC上のサービスに自動的に登録されたtelegrafにより収集されたWindowsのメトリクスを、telegraf.confに設定したinfluxDBサーバに10秒おきに登録されます。この機能は、以後、IPC起動時にサービス設定により自動起動します。